India now stores, sorts and ships more goods than at any point in its history. You can see it on the edges of every big city. Long, low sheds with tall loading docks are rising along highways in Bhiwandi, Chakan, Sriperumbudur and Hoskote. Trucks queue outside them day and night.
This article is an in-depth analysis of three research sources on the Indian warehousing industry: the Knight Frank India Warehousing Market Report 2025, the Mordor Intelligence India Warehouse Market report and the IBEF blog Warehousing and Logistics Sector in India. You will get the numbers, the cities, the rents, the demand drivers and the risks. Every figure is credited to the source that published it. Where the sources disagree, you will see each number side by side.
At the end, there is a separate section with our own reading of what it all means for occupiers, investors, developers and founders. That section is purely an opinion and must be viewed as such. The rest of this article is reported fact.
Warehousing in India at a glance
Here are the headline numbers before we go deeper.
- Knight Frank recorded 72.5 million sq ft of warehouse leasing across India’s eight primary markets in 2025. That is 29% more than in 2024 and the highest level since the pandemic.
- Knight Frank puts total warehousing stock in those eight markets at 549 million sq ft, with vacancy at 11.6%.
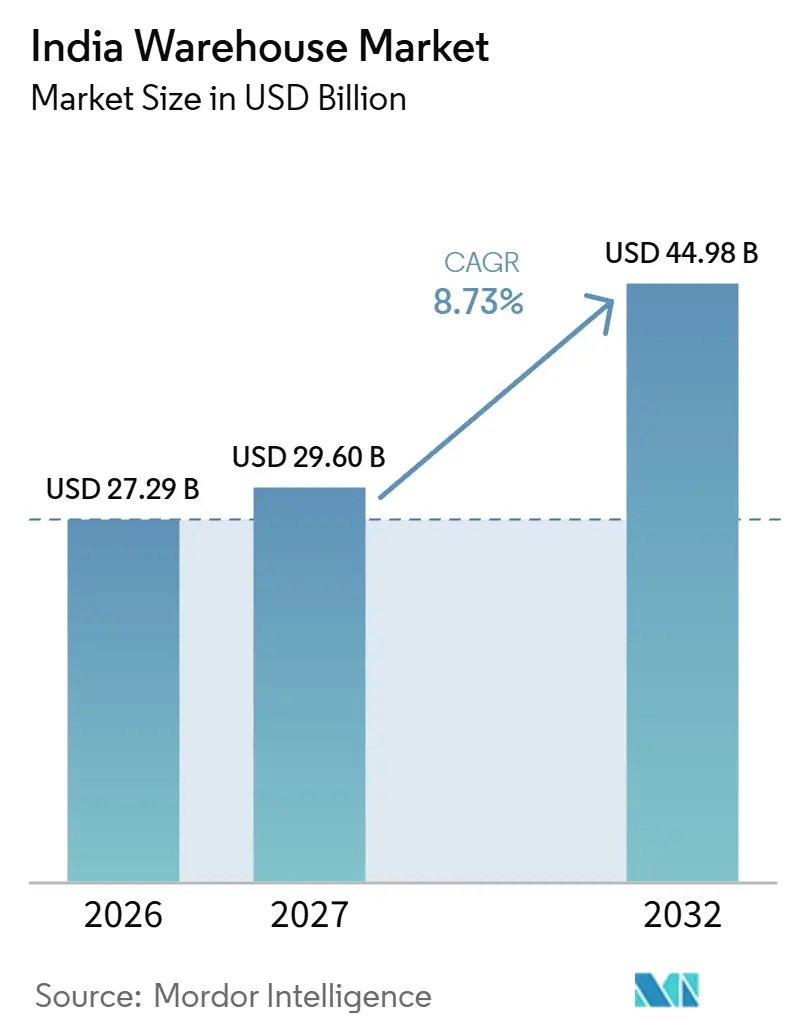
- Mordor Intelligence values the India warehouse market at USD 27.29 billion in 2026 and expects it to reach USD 44.98 billion by 2032.
- IBEF, writing in May 2023, projected the market would reach US$34.99 billion by 2027.
- Manufacturing overtook third-party logistics (3PL) as the largest source of leasing demand in 2025, according to Knight Frank.
- Pune was the busiest city in 2025, with 16.0 million sq ft leased, as per Knight Frank.
The eight primary markets in the Knight Frank report are Mumbai, NCR (the National Capital Region around Delhi), Bengaluru, Chennai, Hyderabad, Pune, Kolkata and Ahmedabad. Keep that list in mind. Most of the city data in this article refers to those eight.
How big is the Indian warehousing market?
This sounds like a simple question. It is not. The answer depends on what you count and who is counting.
Mordor Intelligence: USD 27.29 billion in 2026
Mordor Intelligence estimates the market at USD 27.29 billion in 2026. It expects USD 29.6 billion in 2027 and USD 44.98 billion by 2032. That implies a compound annual growth rate (CAGR) of 8.73% between 2027 and 2032.
Mordor measures spending on paid warehouse occupancy and storage. It leaves out freight transport sold separately, warehouse construction, property sales and separately sold automation equipment. So this is a fairly tight definition. Mordor notes that other estimates it has seen range from USD 17.73 billion to USD 44 billion for 2025, and it puts the gap down to differences in scope.
IBEF: US$34.99 billion by 2027
The IBEF blog, published on 10 May 2023, gives a different number. It says the Indian warehousing market was predicted to reach US$34.99 billion (Rs 2,872.10 billion) by 2027, growing at a CAGR of 15.64% from 2022 to 2027.
IBEF also sizes the wider logistics sector. It cites growth from US$250 billion in 2021 to an expected US$380 billion by 2025, at 10% to 12% a year. It adds that the sector employs over 22 million people and has more than 1,000 players.
Why the numbers differ
So which is right? Both can be, because they measure different things at different times. Mordor’s figure is a 2026 estimate of occupancy and storage spending. IBEF’s is a 2023 forecast, and the blog does not spell out the same scope. The growth rates differ too: 8.73% a year from Mordor against 15.64% a year from IBEF.
Knight Frank does not give a market value in rupees or dollars. It tracks space: how much is leased, how much is built and how much sits empty. For most practical decisions, that is the more useful lens.
| Source | Measure | Figure | Period |
|---|---|---|---|
| Mordor Intelligence | Market size (occupancy and storage spending) | USD 27.29 billion | 2026 |
| Mordor Intelligence | Market size forecast | USD 44.98 billion | 2032 (8.73% CAGR, 2027 to 2032) |
| IBEF | Market size forecast | US$34.99 billion | 2027 (15.64% CAGR, 2022 to 2027) |
| Knight Frank | Leasing, eight primary markets | 72.5 million sq ft | 2025 |
| Knight Frank | Total stock, eight primary markets | 549 million sq ft | 2025 |
A record year for leasing
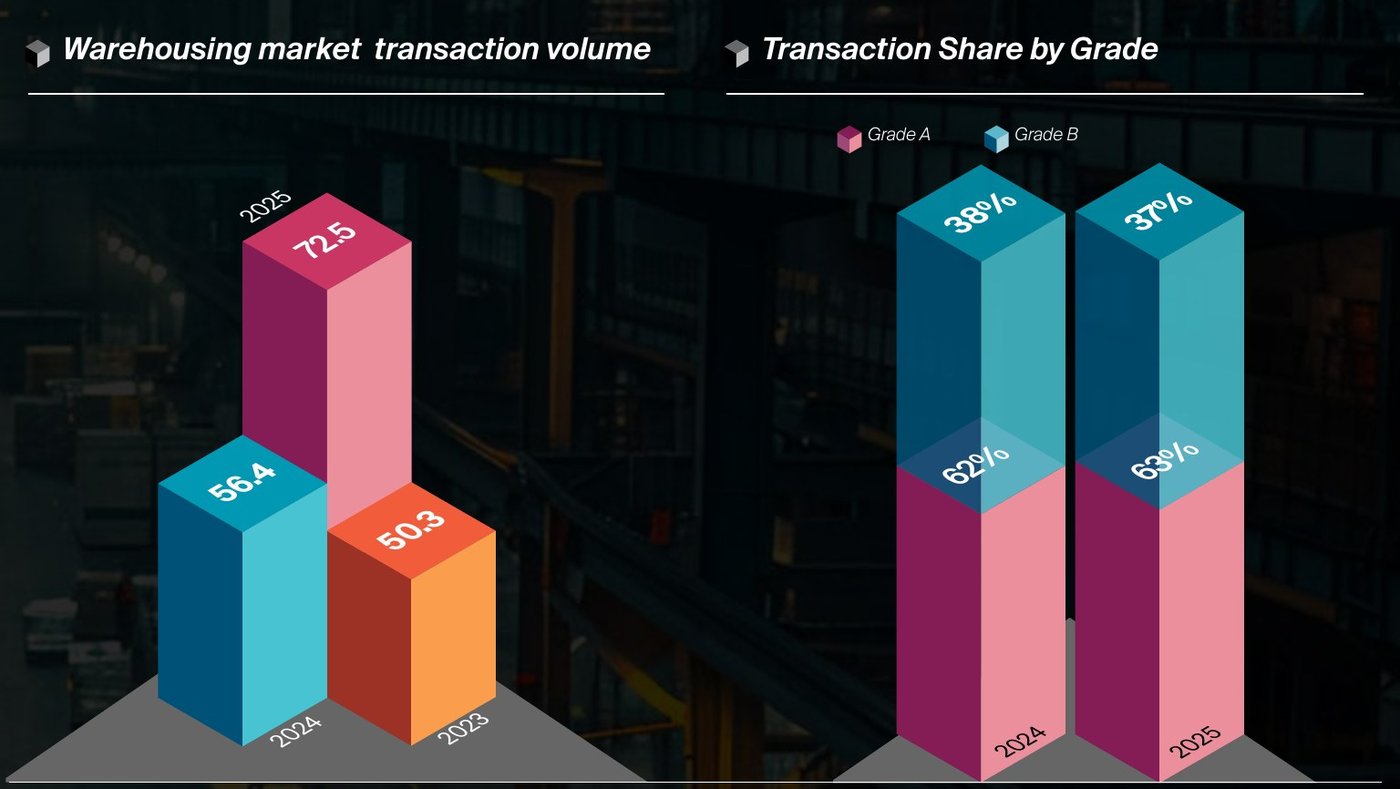
Knight Frank calls 2025 a post-pandemic high. Leasing across the eight primary markets reached 72.5 million sq ft (6.74 million sq m). That compares with 56.4 million sq ft in 2024 and 50.3 million sq ft in 2023.
The final quarter did much of the heavy lifting. Knight Frank says Q4 2025 was the strongest quarter of the year, with 23.4 million sq ft leased.
The report links this to the wider economy. It cites the Reserve Bank of India’s estimate of about 7.4% GDP growth for FY2026. A growing economy makes more goods, sells more goods and needs more places to keep them.
Momentum appears to have carried into 2026. Mordor Intelligence, citing Knight Frank data, reports that Grade B leasing in the eight primary markets rose 51% year on year to 17.8 million sq ft in the first half of 2026.
Who is taking all this space?
The mix of tenants changed sharply in 2025. This is one of the most important shifts in the Knight Frank report.
Manufacturing takes the lead
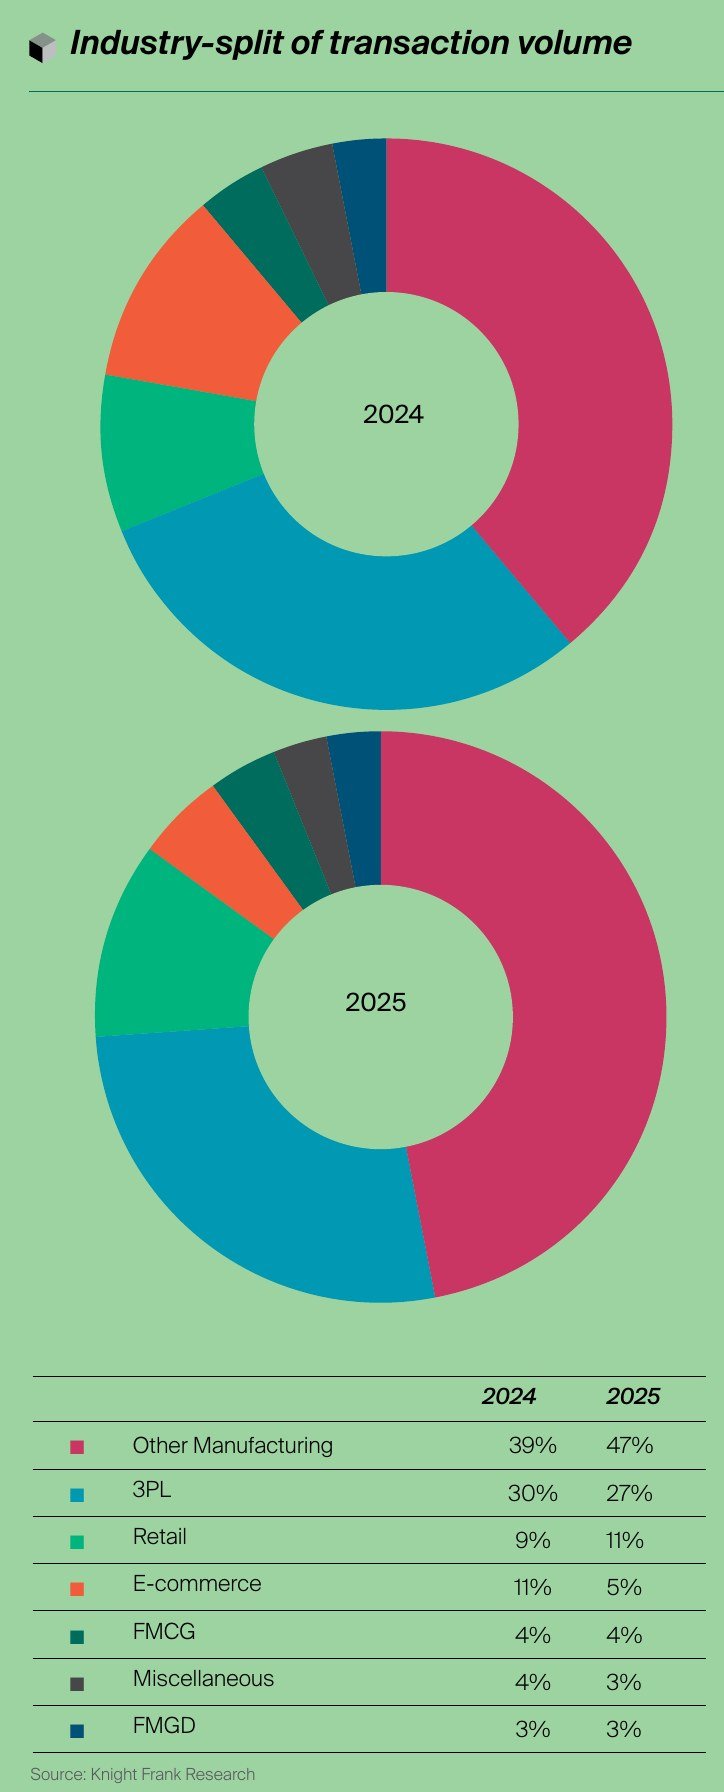
Manufacturing (excluding FMCG and consumer durables) accounted for 47% of all leasing in 2025, up from 39% in 2024. That came to 34 million sq ft, a jump of 55% in a year. Knight Frank names automotive, energy and chemicals as the key sectors.
Where did it happen? Pune and Chennai together accounted for 51% of all manufacturing deals, as per Knight Frank. Both cities have deep automotive supply chains.
Knight Frank links the trend to three forces: the China+1 strategy of global companies, the government’s production-linked incentive (PLI) schemes and growing exports to the US, UK and EU. It also notes that end use is shifting. Space leased for industrial use rose to 30% of the total in 2025, from 18% in 2024. The rest, 70%, was for warehousing.
3PL is still a heavyweight
Third-party logistics firms run warehouses for other businesses. Knight Frank reports they leased 19.6 million sq ft in 2025, up 17%. Their share slipped to 27% from 30%, but only because manufacturing grew faster.
IBEF’s 2023 blog had described 3PL as the top demand segment over the previous five years. Knight Frank’s data shows that position was overtaken in 2025.
E-commerce is back
E-commerce leasing grew 56% to 7.8 million sq ft in 2025, Knight Frank says. That is the highest level since 2021. Its share of leasing reached 11%.
Why the gap after 2021? Knight Frank explains that e-commerce players built up surplus capacity during the pandemic. They spent the next few years filling it. Now that space is used up, they are leasing again. Knight Frank adds that these firms now prefer flexible, leased sites over owning buildings, as land and development costs keep rising.
One note for careful readers: the e-commerce and retail rows in the industry chart of the Knight Frank report appear to be swapped when compared with the text. The text puts e-commerce at 11% of 2025 leasing. We have used the text figure.
What Mordor sees on the demand side
Mordor Intelligence slices demand by spending, not by space. It finds e-commerce and retail held the largest share, at 26.37% of occupancy and storage spending in 2026. It expects pharma and healthcare to grow fastest, at 13.9% a year from 2027 to 2032.
Mordor also points to quick commerce. It cites Flipkart Minutes reaching 1,000 micro-fulfilment centres across more than 130 cities and 8,000 postal codes by 24 June 2026. That is a very different kind of warehouse: small, close to shoppers and spread across many neighbourhoods.
Policy, infrastructure and what drives demand
Government policy shows up in all three sources. Here is what each one says.
GST and the e-way bill
IBEF says reforms such as the Goods and Services Tax (GST) and e-way bills are driving industrial growth, consolidation and efficiency. It also notes that businesses are moving to a hub-and-spoke model, with a few large hubs feeding many smaller sites.
Knight Frank makes the same link at city level. It says GST and e-commerce drove much of NCR’s warehousing growth between 2017 and 2023.
National Logistics Policy
Mordor Intelligence estimates that the National Logistics Policy 2022 adds about 2 percentage points to its CAGR forecast over the long term. It points to an Asian Development Bank-funded programme that includes common standards for warehouses. Common standards make it easier for you to compare buildings across a network.
IBEF says the government plans to cut logistics and supply chain costs from 13% to 14% of GDP down to 10%. Lower logistics costs make Indian goods more competitive at home and abroad.
Freight corridors and logistics parks
Mordor rates dedicated freight corridors and multimodal logistics parks as the largest policy driver, adding about 2.5 percentage points to its forecast. It reports about 2,800 km of corridors completed and about 480 freight trains running daily as of March 2026. On 1 April 2026, six of 15 prioritised multimodal logistics park locations were under implementation.
Knight Frank also mentions the proposed Gati Shakti Cargo Terminals in its section on Surat. It links them with the planned Surat to Dankuni Dedicated Freight Corridor. Beyond that, none of the three sources treats PM Gati Shakti in detail, so this article does not either.
PLI and manufacturing
Mordor reports that PLI schemes had 836 approved applications across 14 sectors by 31 December 2025, and estimates they add about 2 percentage points to growth. Factories need space for raw materials coming in and finished goods going out. Many choose to rent that space instead of building it.
Public spending and foreign investment
IBEF notes that the government planned to invest US$91.38 billion (Rs 7.5 lakh crore) in infrastructure, logistics and multimodal connectivity in FY23. It also mentions free trade logistics parks and warehousing zones. IBEF lists Digital India, BharatNet and the National Logistics Portal as projects that will help digitise the industry.
City by city: where the action is
India does not have one warehousing market. It has many, each with its own tenants and corridors. Here is how the eight primary markets performed in 2025, according to Knight Frank.
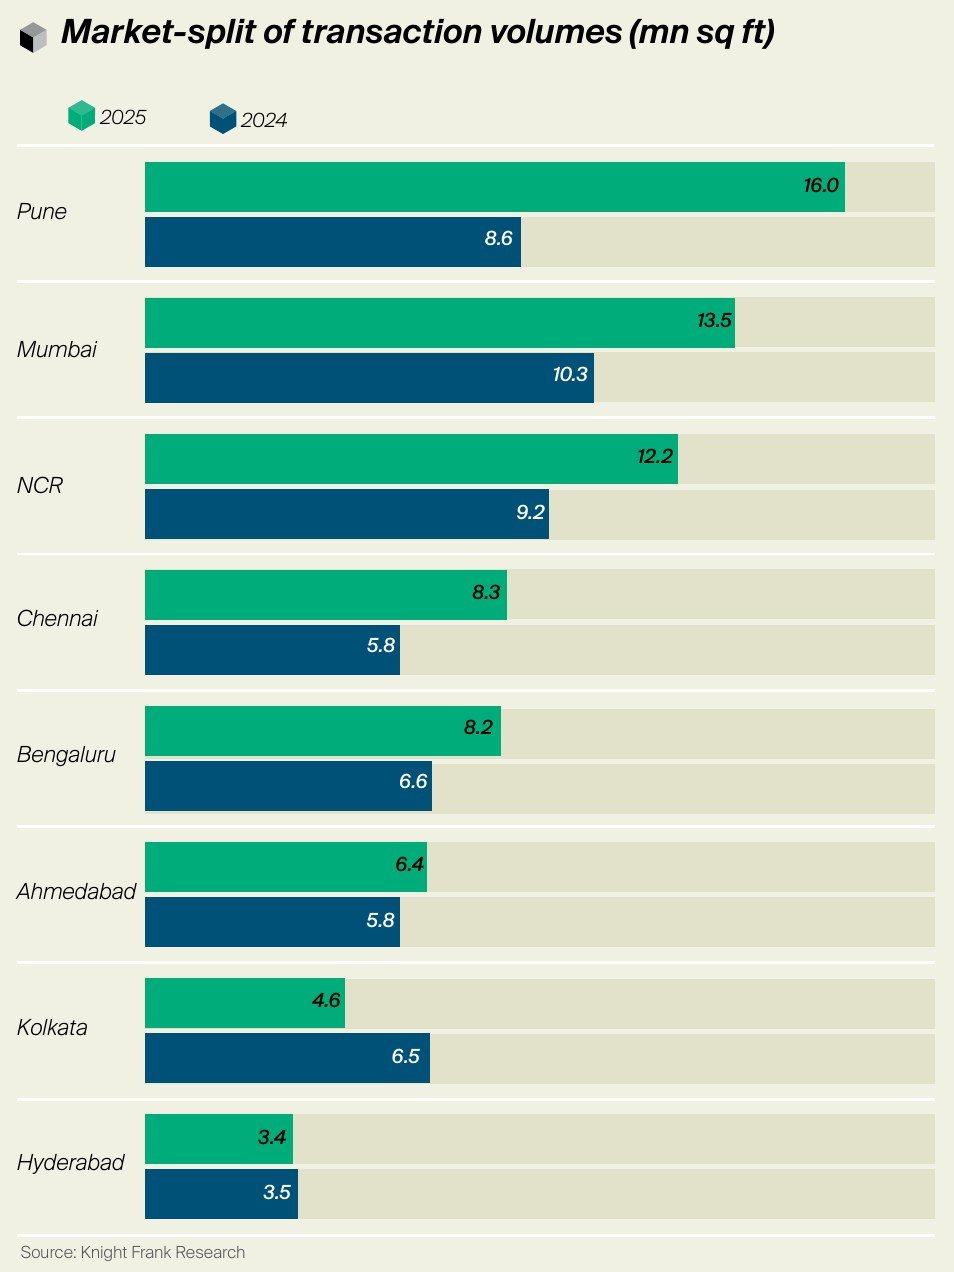
| City | 2024 (mn sq ft) | 2025 (mn sq ft) | Change |
|---|---|---|---|
| Pune | 8.6 | 16.0 | +86% |
| Mumbai | 10.3 | 13.5 | +31% |
| NCR | 9.2 | 12.2 | +32% |
| Chennai | 5.8 | 8.3 | +42% |
| Bengaluru | 6.6 | 8.2 | +24% |
| Ahmedabad | 5.8 | 6.4 | +11% |
| Kolkata | 6.5 | 4.6 | -30% |
| Hyderabad | 3.5 | 3.4 | -3% |
Pune: the new number one
Pune leased 16.0 million sq ft in 2025, up 86%, and took 22% of all leasing. Manufacturing made up 77% of the city’s demand. Knight Frank names Hyundai Transys, Lear, SKS Fasteners and Tata AutoComp among the occupiers. 3PL made up 13%.
The Chakan to Talegaon belt took 80% of the city’s leasing, up from 66% the year before. Grade A rents there run between INR 25 and INR 33 per sq ft per month. Knight Frank expects the Pune Ring Road to add to the region’s appeal.
Mumbai: the biggest stock
Mumbai leased 13.5 million sq ft, up 31%, and took 19% of all leasing. 3PL led with 44% of demand, with DHL, Toll India and Scootsy named by Knight Frank. Other manufacturing rose to 32% from 22%, with Renewsys and Pidilite among the occupiers.
Bhiwandi took 90% of the city’s leasing and Panvel the rest. Land in core Bhiwandi is running short. Knight Frank says that is pushing occupiers toward Taloja and Patalganga. It also names IndoSpace, ESR, Ascendas-Firstspace and Welspun One as the institutional developers adding Grade A supply. The Mumbai Trans-Harbour Link and the now operational Navi Mumbai International Airport should help the region further.
NCR: growth with a Grade B twist
NCR leased 12.2 million sq ft, up 32%. Manufacturing occupiers included Puma, Mitsubishi, Minda, Royal Enfield and Paragon. 3PL players included DB Schenker, Kuehne+Nagel, Yusen, Shadowfax, Blue Dart and Mahindra Logistics.
Here is the twist. Grade B took 60% of NCR’s leasing in 2025, according to Knight Frank. In 2024, Grade A had taken 53%. The NH-48 and KMP Expressway belt accounted for 77% of deals. Faridabad rents rose about 8%. Knight Frank expects the Noida International Airport at Jewar and the YEIDA region to shape future demand, with quick commerce also playing a role.
Chennai: Grade A almost everywhere
Chennai leased 8.3 million sq ft, up 42%. Manufacturing made up 59% of demand and grew 57%. Grade A took 98% of the city’s deals. No other primary market came close.
The Sriperumbudur to Oragadam belt took 77% of leasing, with rents of INR 22 to INR 28 per sq ft per month. The NH16 and GNT Road belt around Periyapalayam took 21%, at INR 19 to INR 23. GST Road towards Maraimalai Nagar took 2%, at INR 26 to INR 29. Industrial use made up 54% of leasing. The city’s three ports, Chennai, Ennore and Kattupalli, are a lasting advantage.
Bengaluru: e-commerce surges
Bengaluru leased 8.2 million sq ft, up 24%. Manufacturing had a 39% share, slightly below 41% in 2024. E-commerce leasing grew 186%. Retail took 16% and 3PL 18%, down from 21%.
The Hoskote to Narsapura belt took 54% of leasing, or 4.4 million sq ft. Grade A rose to 82% of deals from 56%. Industrial use climbed to 23% of leasing from 10%.
Ahmedabad: steady and pharma-friendly
Ahmedabad leased 6.4 million sq ft, up 11%. Manufacturing led with 46% of demand, and Grade A took 64%. Aslali to Kheda took 43% of leasing. Changodar to Bagodara took 41%, with pharma a key user. Becharaji took 12% and Sanand 3%. Knight Frank puts rents in the city’s clusters between INR 15 and INR 27 per sq ft per month.
Kolkata: a tough year
Kolkata leased 4.6 million sq ft, a fall of 30%. Knight Frank blames high land prices and a shortage of Grade A space. 3PL’s share fell to 32% from 42%, with Kuehne+Nagel and Jeena named. E-commerce took 22%, with Amazon and Zomato among occupiers. Manufacturing rose to 21% from 13%. Dankuni took 60% of leasing and the NH16 belt 40%. Warehousing, not industrial use, made up 96% of deals.
Hyderabad: flat
Hyderabad leased 3.4 million sq ft, broadly flat on 2024. 3PL and manufacturing together took 66% of demand and e-commerce 21%. Grade A took 55%. Medchal took 60% of leasing, Shamshabad 30% and Patancheru 10%. Knight Frank puts rents across these clusters between INR 22 and INR 28.
Beyond the big eight
Knight Frank also tracks 13 secondary markets: Lucknow, Ambala, Surat, Jaipur, Guwahati, Patna, Nagpur, Indore, Ranchi, Vadodara, Vapi, Ludhiana and Bhubaneswar. Together they leased 11.2 million sq ft in 2025, down 1%.
IBEF had already spotted this trend in 2023. It noted that 3PL and e-commerce firms were expanding into tier 2 and tier 3 cities.
Lucknow was the largest at 1.9 million sq ft, up 9%. Consumer durables took 35% of its demand, FMCG 23% and e-commerce 19%. Hindustan Unilever, Whirlpool, Safexpress and Swiggy were among the occupiers. Most of Lucknow’s space is Grade B, but Welspun, Reciprocal and Hiranandani are developing new parks there.
Surat (1.49 million sq ft), Jaipur (1.31 million sq ft) and Ambala to Rajpura (1.21 million sq ft) followed. Nagpur stood out with growth of 204% to 0.91 million sq ft. Grade A made up 54% of secondary market leasing, up from 53%.
Grade A versus Grade B
You will hear “Grade A” a lot in this industry. IBEF describes Grade A warehouses as modern buildings designed for logistics, with up-to-date technology, better building materials, a prime location and easy road access. It describes Grade B as older buildings that would need rebuilding to meet modern logistics standards.
The shift to quality
Knight Frank says Grade A made up 63% of leasing in 2025, up from 62%. Grade A now forms 45% of total stock, against 41% a year earlier. Occupiers want efficiency, compliance, automation readiness and ESG-aligned buildings, according to the report.
The Grade A share of stock varies widely by city. Knight Frank puts it at 78% in Chennai and 69% in Pune. It is 57% in Kolkata, 51% in Hyderabad, 50% in Bengaluru, 48% in Ahmedabad, 39% in NCR and just 29% in Mumbai. (The Pune figure appears as 68% in the report’s chart and 69% in its text.)
But Grade B still matters
Mordor Intelligence shows the other side. It finds Grade B held the largest share of spending in 2026, at 40.89%. It expects Grade A to grow fastest, at 14.05% a year from 2027 to 2032.
Mordor links the recent Grade B surge mainly to busy leasing in Mumbai and NCR, the two markets with the lowest Grade A shares. In other words, tenants often take what is available where they need to be. Cost also plays a part, as the Lucknow example shows.
IBEF gives an older baseline. It says Grade A and Grade B stock in the top eight cities was 287 million sq ft at the end of 2021, a 21% rise on 238 million sq ft. Grade A stock was 134 million sq ft, with a five-year CAGR of 29.9%. NCR, Mumbai and Bengaluru held more than half of the stock at that time.
Supply, stock and vacancy
Knight Frank puts total stock in the eight primary markets at 549 million sq ft (51.0 million sq m) in 2025, up from 486 million sq ft in 2024. Mumbai holds 31% of it and NCR 21%.
Vacancy was 11.6%, almost unchanged from 11.5% a year earlier. That tells you new supply kept pace with record demand.
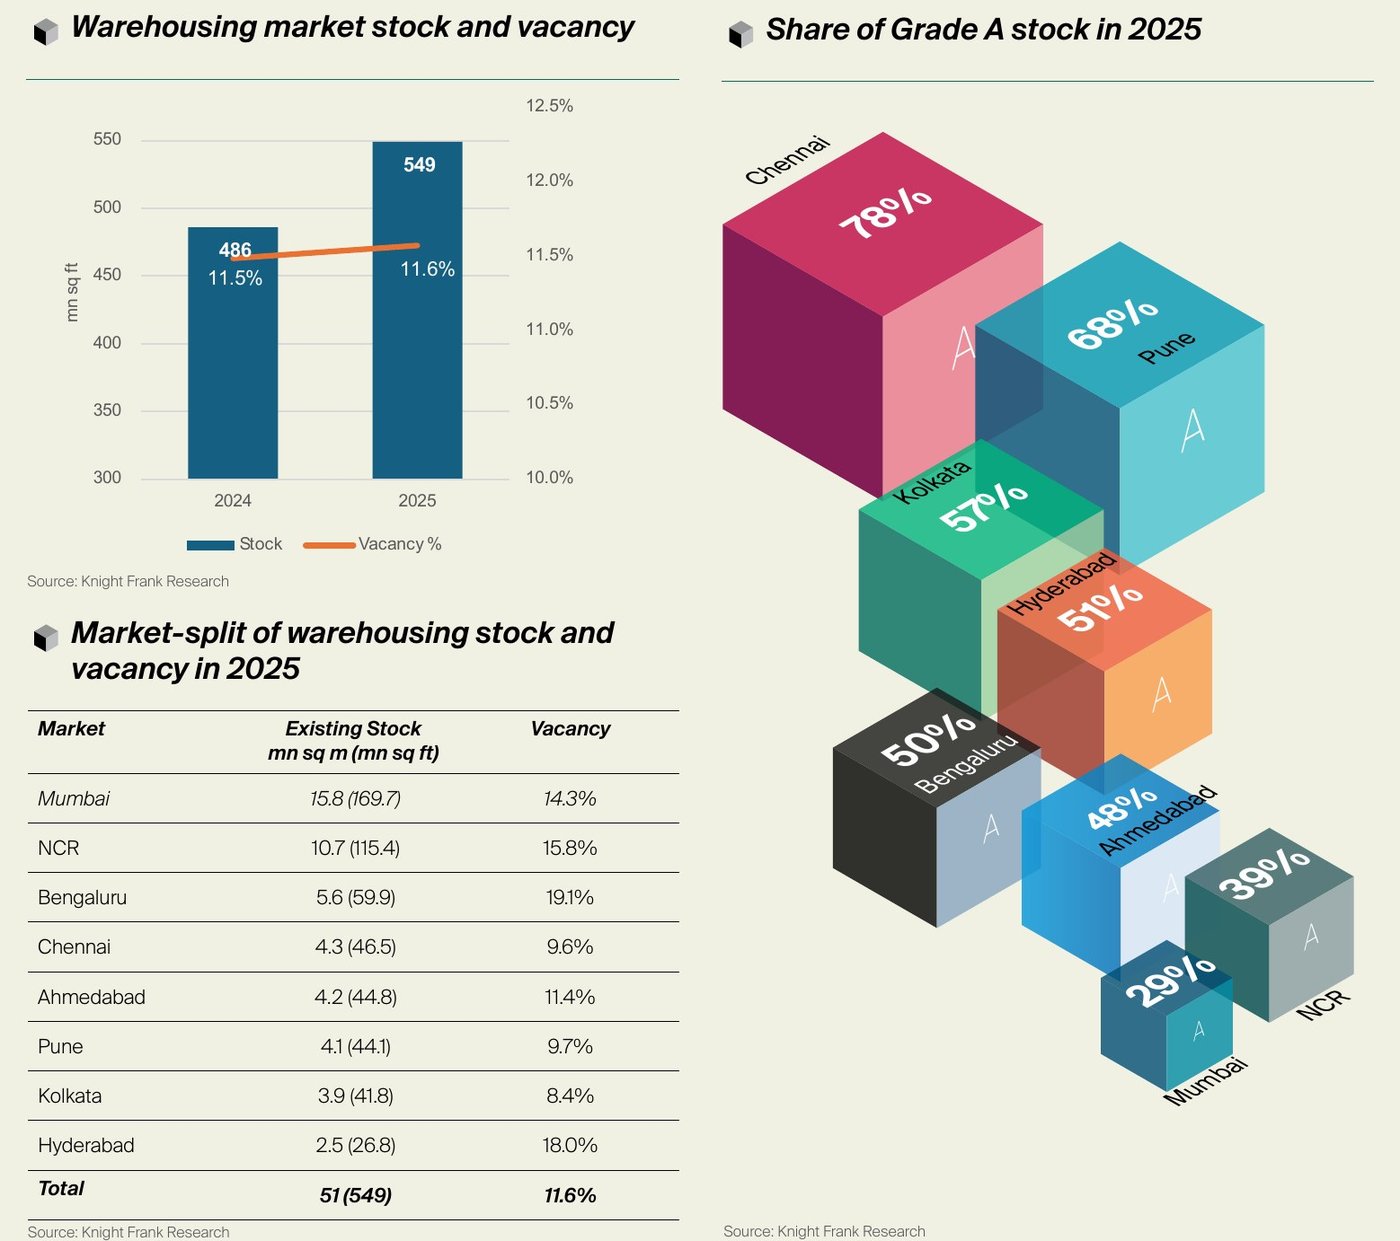
| City | Stock (mn sq ft) | Vacancy |
|---|---|---|
| Mumbai | 169.7 | 14.3% |
| NCR | 115.4 | 15.8% |
| Bengaluru | 59.9 | 19.1% |
| Chennai | 46.5 | 9.6% |
| Ahmedabad | 44.8 | 11.4% |
| Pune | 44.1 | 9.7% |
| Kolkata | 41.8 | 8.4% |
| Hyderabad | 26.8 | 18.0% |
Notice the spread. Kolkata, Chennai and Pune are tight, with vacancy below 10%. Bengaluru and Hyderabad have more empty space, at 19.1% and 18.0%.
There is plenty more to come. Knight Frank estimates 256.2 million sq ft of potential space within established parks. That is more than three times annual demand. So supply is unlikely to run out soon, at least in parks that already exist.
Rents: steady, not spectacular
Rents rose in every primary market in 2025, but only by 1% to 5%. Knight Frank explains that rents were muted for about a decade. They started rising from 2021 as steel and cement costs climbed. Long leases keep yearly growth in check.
| City | 2024 rent (INR/sq ft/month) | 2025 rent (INR/sq ft/month) | Change |
|---|---|---|---|
| Pune | 26.6 | 28.0 | 5% |
| Chennai | 23.9 | 25.0 | 5% |
| Hyderabad | 20.7 | 21.5 | 4% |
| Bengaluru | 22.5 | 23.2 | 3% |
| Mumbai | 24.5 | 25.2 | 3% |
| NCR | 21.3 | 21.9 | 3% |
| Ahmedabad | 18.2 | 18.6 | 2% |
| Kolkata | 24.8 | 25.0 | 1% |
Pune is now the most expensive of the eight, at INR 28.0 per sq ft per month. Ahmedabad is the cheapest at INR 18.6. Kolkata’s rents barely moved, which fits with its weak year for leasing.
Key players and investors
Operators and developers
Mordor Intelligence rates market concentration as medium. It lists DHL Group, Mahindra Logistics, TVS Supply Chain Solutions, IndoSpace and Allcargo Logistics among the major players. It gives some recent examples:
- DHL Supply Chain India registered a lease for over 417,000 sq ft at One Samruddhi Park in Amane, Bhiwandi, on 7 November 2025.
- TVS Supply Chain Solutions announced on 10 March 2026 that it was setting up a 40,000 sq ft warehouse in the Free Trade and Warehousing Zone at Mannur, about 30 km from Chennai, to support Caterpillar.
- IndoSpace launched a 66-acre park in Bhiwandi in September 2025.
- Allcargo reported 6% revenue growth in contract logistics for the quarter to 30 June 2026.
Knight Frank adds IndoSpace, ESR, Ascendas-Firstspace and Welspun One as institutional developers in Mumbai, and Welspun, Reciprocal and Hiranandani in Lucknow.
Public sector storage
The state is a big warehouse owner too. Mordor reports that the Food Corporation of India had 47.07 million metric tonnes of covered foodgrain capacity on 1 February 2026: 32.35 million hired and 14.72 million owned. State agencies had another 38.19 million tonnes.
Mordor also notes a Central Warehousing Corporation tender to develop eight locations through public-private partnership, with bids due on 29 October 2026. It cites a NITI Aayog plan for FY26 to FY30 to modernise 54 CWC locations. And it reports a Warehousing Development and Regulatory Authority notification of 20 August 2026 that removes fixed registration deposits.
Investment flows
IBEF’s 2023 blog gives a picture of investor interest at that time. It reports US$1.8 billion of private equity and venture capital went into industrial and logistics parks and data centres in 2022, up 29%. It says the warehouse and logistics sector drew US$5.4 billion of institutional investment between 2019 and 2022, with 35% of it in 2022 alone. Warehousing took the second-largest share of institutional real estate investment in both years: 27% in 2021 and 31% in 2022, as per IBEF. Over 2019 to 2022, the western region, led by Mumbai, Pune and Becharaji, drew 35% of warehousing investment.
These IBEF numbers are now more than three years old. Treat them as history, not a current read.
Cold chain: small base, fast growth
Cold storage is a niche within warehousing, but it is growing quickly. Mordor Intelligence expects refrigerated warehousing to be the fastest-growing type, at 13.12% a year from 2027 to 2032. General warehousing still held 58.4% of spending in 2026.
India had 40.22 million metric tonnes of cold storage capacity across 8,815 facilities by June 2025, Mordor reports. About three-quarters of it is used for potatoes. That leaves a gap for modern, multi-temperature space for pharma, dairy, meat, seafood and ready meals.
Mordor gives one example: DP World opened a 110,000 sq ft Grade A cold chain warehouse in Taloja, Navi Mumbai, on 13 May 2025, with 11,000 pallet positions and several temperature zones. It also notes that power cuts are a real problem for cold storage in some areas, citing the National Centre for Cold Chain Development’s 2026 guidelines. Solar-powered cold rooms can help, but cost more up front.
Technology and automation
IBEF names the Internet of Things, robotics and artificial intelligence as key technologies changing warehousing. It says transport management systems (TMS) and warehouse management systems (WMS) have helped logistics firms raise efficiency, cut costs and serve customers better. It also highlights the rise of direct-to-consumer brands and omni-channel retail.
Knight Frank says occupiers now look for automation readiness when choosing a building. It notes that institutional developers in Mumbai are building automation-ready designs, and it expects more technology-enabled warehousing in that market.
Mordor adds a note of caution. It lists a shortage of skilled automation technicians and unreliable grid power as restraints. Robots and conveyors are only useful when the power stays on and someone can fix them.
Mordor also flags green buildings. It estimates that ESG-compliant “green warehouse” certifications add about 0.8 percentage points to growth, as they attract premium tenants. Returns processing for e-commerce adds another 0.7 points.
Challenges facing the industry
It is not all good news. Here are the main risks named in the three sources.
- Land with clear title. Knight Frank names the scarcity of land with clean ownership records as a key challenge. Large, clean plots near cities are hard to find.
- Competition from housing. Knight Frank notes that residential projects compete for the same land on city edges.
- Policy and regulation. Knight Frank flags regulatory and policy factors that need careful handling.
- Slow clearances. Mordor estimates that environmental and fire safety approvals take about 1 percentage point off its growth forecast. It cites a warehouse project in Jatauli, Haryana, held up by forest land issues.
- Power supply. Mordor puts the drag from unreliable grid power at about 0.7 points.
- Skills. A shortage of automation technicians takes about 0.4 points off, per Mordor.
- Insurance. Rising premiums linked to fire and climate risk take about 0.2 points off, with Bhiwandi named as an example by Mordor.
- High logistics costs. IBEF notes that roads carried 73% of freight in FY21, against 18% by rail, citing KPMG. Heavy reliance on roads keeps costs high.
Mordor stresses that these impacts are directional. They do not simply add up.
Outlook
All three sources are positive about the years ahead.
Knight Frank expects demand to stay strong. It points to China+1, the India EU trade agreement, steady 3PL demand, the e-commerce recovery and the formalisation of the market. It expects the share of Grade A space to keep rising.
Mordor Intelligence expects 8.73% yearly growth from 2027 to 2032, with Grade A, cold storage, pharma and South India growing fastest. It expects West India, which held 34.71% of spending in 2026, to remain the largest region.
IBEF’s 2023 forecast of 15.64% yearly growth to 2027 is the most bullish of the three, though it is also the oldest.
An analyst’s perspective: what this means for you
This section is our own interpretation of the data above. It is an opinion, not reported fact.
If you are an occupier
- Pune and Chennai are the clearest manufacturing hubs. If you make cars, parts or chemicals, start your search there.
- Rents are rising slowly. Lock in longer leases now, with fair escalation clauses, before costs climb further.
- Vacancy is low in Pune, Chennai and Kolkata. Plan early in those cities. You may have more choice and better terms in Bengaluru and Hyderabad.
- Ask about power backup, fire safety and insurance costs before you sign. These risks now show up in the data.
If you are an investor
- Leasing is at a post-pandemic high and vacancy is stable. That suggests a healthy balance between supply and demand.
- The rent story is about stability, not big jumps. Warehousing looks more like a steady income asset than a fast growth bet.
- Grade A has room to grow in Mumbai and NCR, where its share of stock is lowest. That is where upgrading old stock could pay off.
- Cold chain and pharma storage look under-built for the demand Mordor expects.
If you are a developer
- Clean land is the main constraint. Owning a land bank with clear titles may be your strongest edge.
- Watch the freight corridors and logistics parks. Mordor’s data suggests demand will cluster around them as they open.
- Build for automation and green certification. Knight Frank and Mordor both say tenants are asking for it.
- Secondary cities like Lucknow and Nagpur are growing but still lack Grade A stock. Early entry could pay off.
If you are a founder
- Quick commerce needs many small sites close to customers. That is a different business from big parks on highways.
- Skills are scarce. Training and maintaining warehouse automation could be a business on its own.
- Returns processing, cold chain and multi-client storage for small brands all appear as gaps in the data.
- Power, insurance and approvals are pain points. Tools or services that ease them have a ready market.
- Warehouse automation will be the key to sustainability and profitability for your warehousing operations.
The key takeaway: India’s warehousing story has moved from “more space” to “better space in the right places”. Manufacturing, not just online shopping, now sets the pace. If you match quality and location to that shift, the numbers suggest you are on the right side of it.
Sources and references
- Knight Frank, India Warehousing Market Report 2025: knightfrank.co.in
- Mordor Intelligence, India Warehouse Market (page updated 23 October 2026): mordorintelligence.com
- IBEF, Warehousing and Logistics Sector in India (10 May 2023): ibef.org
Charts from the Knight Frank report are reproduced with credit to Knight Frank, the copyright owner. The Mordor Intelligence chart is reproduced under the CC BY 4.0 licence with attribution to Mordor Intelligence. All figures are attributed to the source that published them. Readers should check the original reports before making any business decision.
Featured image: Photo by Tiger Lily on Pexels. Charts: © Knight Frank, from the India Warehousing Market Report 2025; © Mordor Intelligence, from the India Warehouse Market report, used under CC BY 4.0.
Image used just for representational purposes. It may, or may not, have any relevance to the story.